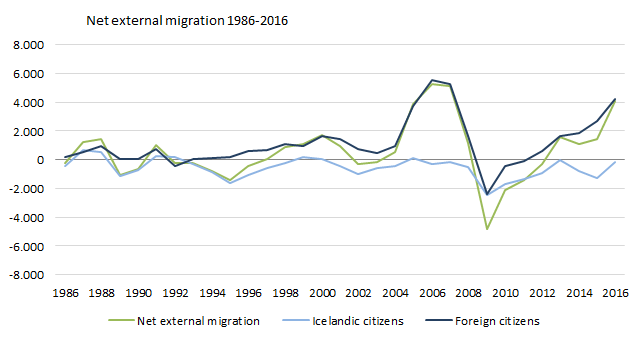
Net external migration in Iceland in 2016 was 4,069 compared with 1,451 in last year. The number of immigrants was 10,958 in 2016 compared with 7,461 in 2015. At the same time the number of emigrants increased from 6,010 in 2015 to 6,889 in 2016.
Denmark the most popular country of destination for Icelandic citizens
Of the 3,245 Icelandic citizens who emigrated in 2016, a total of 2,134 migrated to Norway, Denmark or Sweden. Most of them emigrated to Denmark, or 993. These countries were also the major countries of origin for immigrating Icelandic citizens, as 2,149 out of 3,099 immigrants came from these countries.
Most of the foreign citizens emigrating from Iceland migrated to Poland, or 1,089 out of 3,644. Poland was also the largest contributor of immigrants with foreign citizenship, 2,826 persons out of 7,859 foreign immigrants.
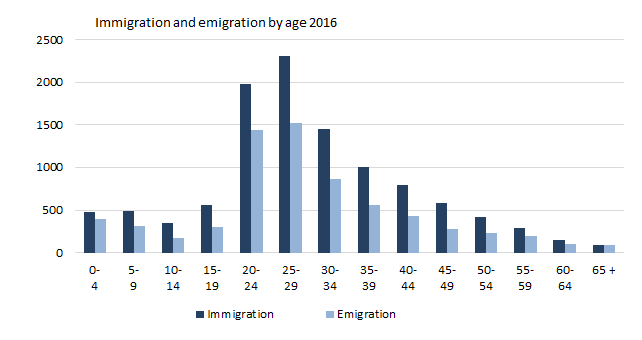
Most frequent age of emigrants 24 years
The most frequent age group among those who emigrated or immigrated in 2016 was 20–29 years old, 40.6%. However, the modal age of emigrants was 24 years and the modal age of immigrants was 26 years.
Sex ratio of international migrants
A significant change in the sex ratio of international migrants has taken place in recent years. Up until 2003 more females than males migrated each year to Iceland. This changed dramatically between 2004 and 2008 when 4,215 more males than females immigrated to Iceland. Between 2009 and 2012 respectively, 4,114 more males than females emigrated from Iceland. In 2016, males exceeded females by 1,729 in net migration.
Most foreign citizens from Poland
From the year 1996, the highest numbers of foreign immigrants to Iceland were Polish citizens, with the exception of 2004, when Portuguese citizens where most numerous. In 2016, 2,873 people with Polish citizenship immigrated to Iceland, and Polish citizens were also the largest group of foreign nationals to emigrate from Iceland in 2016, or 1,117.
The Southwest region receives
When only taking into account internal migration between regions in the year 2016, only two regions had favorable net migration. The Southwest had most internal migration (562) and the South had 98. Other regions had negative net migration. When considering external and internal migration, all except two of the country’s regions experienced positive net migration in 2016, Westfjords (-42) and East (-27).
| Migration by regions 2016 | |||
| Net migration | |||
| Total | Internal | External | |
| Total | 4,069 | • | 4,069 |
| Capital region | 1.977 | -233 | 2.210 |
| Southwest | 1.337 | 562 | 775 |
| West | 94 | -58 | 152 |
| Westfjords | -42 | -102 | 60 |
| Northwest | 15 | -19 | 34 |
| Northeast | 247 | -102 | 349 |
| East | -27 | -146 | 119 |
| South | 468 | 98 | 370 |