The number of persons in the labour force in August 2013 was 188,300 which corresponds to an activity rate of 82.9%. The number of employed persons was 180,000 and unemployed persons were 8,300. The employment rate was 79.3% and the unemployment rate was 4.4%. The unemployment rate has decreased by 1.3 percentage points from August 2012 when it was 5.7%. In August 2013 the male unemployment rate was 4.6% compared to 4.9% in August 2012 and the female unemployment rate was 4.2% compared to 6.7% in August 2012.
Figure 1. Labour force August 2013
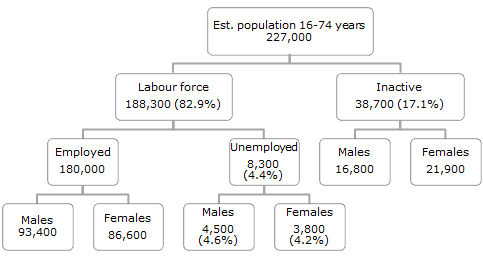
Figures August not add up because of rounding.
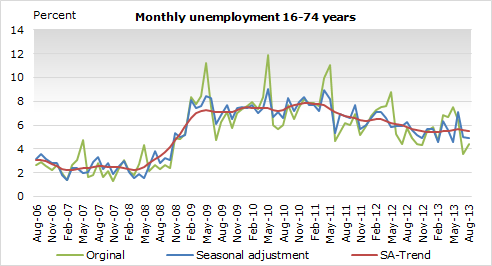
Seasonally adjusted unemployment 4.9%
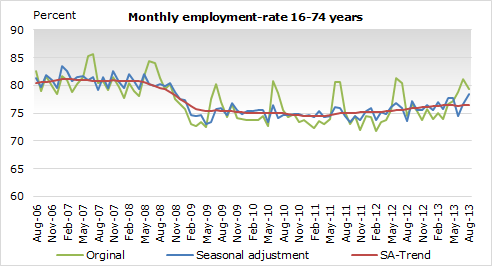
The seasonally adjusted data shows that in August 2013 the number of people in the labour force was 186,900 or 82.5% activity rate compared to 183,400 and 80.7% in July. The number of unemployed persons amounted to 9.200 or 4.9% which is the same as in July. The number of seasonally adjusted employed persons in August was 177,700 or 78.4% compared to 174,200 and 76.7% in July.
The seasonally adjusted trend data shows little or no change for the last six months both in numbers and percentage. The twelve month trend for activity has increased 1.6%, employment has increased by 2.4% and unemployment has decreased by 1.6%.
Implementation
August 2013 is divided in to four weeks, from the 29th of July to 1st of September 2013. The total sample size was 1,505 persons, 16–74 years randomly chosen from the Population Register. When those who had passed away or those who were living abroad had been deducted from the sample the net sample was 1,465 persons. In total the number of usable answers was 1,186 which correspond to 80.4% response rate. All figures have been weighted by sex and age groups. The confidence limit of the results on activity rate is ±2 points, employment rate is ±2.2% and unemployment rate is ±1.3%. Figures may not add up because of rounding.
| Table 1. Labour market in August - Original | ||||||
| CI | CI | CI | ||||
| 2011 | (±95%) | 2012 | (±95%) | 2013 | (±95%) | |
| Total 16-74 years | ||||||
| Activity rate | 80.3 | 2.4 | 78.9 | 2.2 | 82.9 | 2 |
| Employment rate | 75.3 | 2.6 | 74.4 | 2.4 | 79.3 | 2.2 |
| Unemployment rate | 6.2 | 1.6 | 5.7 | 1.5 | 4.4 | 1.3 |
| Hours of work | 42.3 | 1.4 | 40.4 | 1.1 | 40.9 | 1.2 |
| Labour force | 180,900 | 5,300 | 176,400 | 5,100 | 188,300 | 4,600 |
| Employed | 169,600 | 5,800 | 166,300 | 5,400 | 180,000 | 5,100 |
| Unemployed | 11,200 | 3,000 | 10,100 | 2,600 | 8,300 | 2,500 |
| Inactive | 44,500 | 5,300 | 47,100 | 5,100 | 38,700 | 4,600 |
| Est. population | 225,300 | • | 223,500 | • | 227,000 | • |
| Table 2. Labour market last 6 months - Seasonal adjustment | ||||||
| Mar-13 | Apr-13 | May-13 | Jun-13 | Jul-13 | Aug-13 | |
| Total 16-74 years | ||||||
| Activity rate | 80.9 | 82.3 | 81.4 | 80.2 | 80.7 | 82.5 |
| Employment rate | 75.7 | 77.7 | 77.7 | 74.5 | 76.7 | 78.4 |
| Unemployment rate | 6.4 | 5.6 | 4.6 | 7.1 | 5.0 | 4.9 |
| Hours of work | 40.7 | 38.7 | 39.7 | 40.6 | 40.2 | 39.8 |
| Labour force | 183,300 | 185,600 | 183,800 | 181,600 | 183,400 | 186,900 |
| Employed | 171,600 | 175,200 | 175,400 | 168,600 | 174,200 | 177,700 |
| Unemployed | 11,700 | 10,400 | 8,500 | 12,900 | 9,200 | 9,200 |
| Inactive | 43,300 | 40,000 | 42,000 | 44,900 | 43,800 | 39,700 |
| Est. population | 226,600 | 225,600 | 225,800 | 226,400 | 227,200 | 226,600 |
| Table 3. Labour market last 6 months - Seasonal adjustment trend | ||||||
| Feb-13 | Mar-13 | Apr-13 | May-13 | Jun-13 | Aug-13 | |
| Total 16-74 years | ||||||
| Activity rate | 80.8 | 80.9 | 80.9 | 80.9 | 80.9 | 80.9 |
| Employment rate | 76.4 | 76.4 | 76.4 | 76.3 | 76.4 | 76.5 |
| Unemployment rate | 5.5 | 5.5 | 5.6 | 5.6 | 5.6 | 5.5 |
| Hours of work | 39.8 | 39.8 | 39.8 | 39.8 | 39.8 | 39.8 |
| Labour force | 182,900 | 183,400 | 183,700 | 183,700 | 183,800 | 184,000 |
| Employed | 172,900 | 173,300 | 173,500 | 173,400 | 173,600 | 173,900 |
| Unemployed | 10,000 | 10,100 | 10,200 | 10,300 | 10,200 | 10,100 |
| Inactive | 43,400 | 43,400 | 43,400 | 43,400 | 43,400 | 43,400 |
| Est. population | 226,400 | 226,800 | 227,100 | 227,200 | 227,200 | 227,400 |