Declining number of emigrants
Net external migration was -319 in 2012 compared with -1,404 in 2011. The number of immigrants was 5,957 in 2012 compared with 5,578 in 2011. At the same time the number of emigrants declined from 6,982 in 2011 to 6,276 in 2012.
Norway the most popular country of destination for Icelandic citizens
Of the 4,066 Icelandic citizens who migrated in 2012, a total of 3,015 migrated to Norway, Denmark or Sweden. Most of them migrated to Norway, or 1,395. Norway has been the most popular destination for Icelandic citizens since 2009. These countries were also the major countries of origin for immigrating Icelandic citizens, as 2,321 out of 3,130 immigrants came from these countries.
Most of the foreign citizens emigrating from Iceland migrated to Poland, or 740 out of 2,181. Poland was also the biggest contributor to immigrants with foreign citizenship, 886 persons out of 2,794 foreign immigrants.
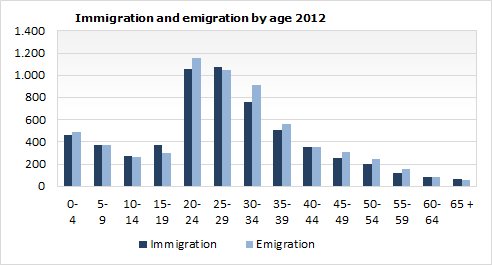
Modal age of the emigrants was 24 years
The most frequent age group among those who emigrated in 2012 was 20–24 years old. The modal age, however, was 24 years. Immigrants were younger than emigrants, the highest number was in the 25–29 year old age group, and the modal age was 26 years. Considering net migration, the age group 30–34 years experienced the highest negative net migration.
Sex ratio stabilises
A significant change in the sex ratio of international migrants has taken place in recent years. Up until 2003 more females than males migrated every year to Iceland. This changed dramatically between 2004 and 2008 when 4,215 more males than females immigrated to Iceland. In the four years since the trend was reversed with 4,114 more males than females emigrating from Iceland in excess of immigration.
The capital region receives
The internal migration in 2012 was characterised by a migration flow to the Capital region from all other regions, mostly from the South- and Northwest regions. When considering external and internal migration, all regions of the country experienced negative net migration in 2012 except the Westfjords.
| Migration by regions 2012 | |||
| Net migration | |||
| Total | Internal | External | |
| Total | -319 | • | -319 |
| Capital region | 313 | 525 | -212 |
| Southwest | -238 | -152 | -86 |
| West | -113 | -142 | 29 |
| Westfjords | 38 | 16 | 22 |
| Northwest | -62 | -17 | -45 |
| Northeast | -207 | -206 | -1 |
| East | -12 | 5 | -17 |
| South | -38 | -29 | -9 |
Statistics