Net external migration was 1,119 in 2014 compared with 1,159 in 2013. The number of immigrants was 6,988 in 2013 compared with 7,071 in 2013. At the same time the number of emigrants increased from 5,473 in 2013 to 5,875 in 2014.
Norway is the most popular country of destination for Icelandic citizens
Of the 3,400 Icelandic citizens who migrated in 2014, a total of 2,396 migrated to Norway, Denmark or Sweden. Most of them migrated to Norway, or 1,004. Norway has been the most popular destination for Icelandic citizens since 2009. These countries were also the major countries of origin for immigrating Icelandic citizens, as 1,837 out of 2,640 immigrants came from these countries.
Most of the foreign citizens emigrating from Iceland migrated to Poland, or 601 out of 2,475. Poland was also the biggest contributor to immigrants with foreign citizenship, 1,393 persons out of 2,475 foreign immigrants.
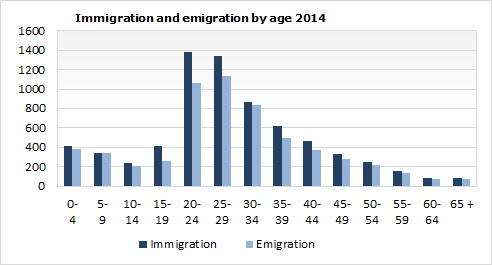
The most usual age of emigrants was 23 years
The most frequent age group among those who emigrated or immigrated in 2014 was 20–29 years old, 38%. However, the modal age of emigrants was 23 years and the modal ages of immigrants were 24 and 25 years in the year 2014. Considering net migration, the age group 65–69 years experienced the only negative net migration in 2014.
Sex ratio of international migrants
A significant change in the sex ratio of international migrants has taken place in recent years. Up until 2003 more females than males migrated each year to Iceland. This changed dramatically between 2004 and 2008 when 4,215 more males than females immigrated to Iceland. Between 2009 and 2012 respectively, 4,114 more males than females emigrated from Iceland. In 2014, males exceeded females by 287 in net migration.
| Migration by regions 2014 | |||
| Net migration | |||
| Total | Internal | External | |
| Total | 1,113 | • | 1,113 |
| Capital region | 942 | 357 | 585 |
| Southwest | 279 | 145 | 134 |
| West | 2 | -69 | 71 |
| Westfjords | -26 | -103 | 77 |
| Northwest | -135 | -151 | 16 |
| Northeast | 14 | 1 | 13 |
| East | -107 | -146 | 39 |
| South | 144 | -34 | 178 |
The capital region receives
The internal migration in 2014 was characterized by a migration flow to the Capital region from all other regions except the Southwest and Northeast. When considering external and internal migration, three of the country’s regions experienced negative net migration in 2014, Northwest (-135), East (-107) and Northeast (-26).
Statistics