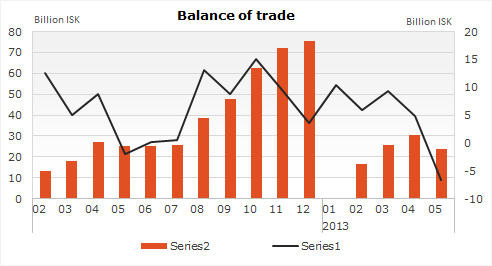
Balance of trade
The value of exported goods from Iceland amounted to ISK 251,300 million fob and the value of imported goods amounted to ISK 227,500 million fob (ISK 245,700 million cif) January-May 2013. Thus there was a trade surplus, calculated on fob value, of ISK 23,800 million as compared with a trade surplus of ISK 25,800 million in January-May 2012, at current rates of exchange¹.
Exports
The total value of exports of goods the first five months of 2013 was ISK 10,700 million or 4.1% lower at current rates of exchange than in the same period the year before. Exported manufacturing products were 52.6% of total exported goods and their value was 4.7% less than in the same period the year before. Marine products were 43.4% of the total exports and their value 2.1% less than the same period the year before. The decrease in the exports of manufacturing products and marine products are partly because of lower price of the products.
Imports
The total value of imports of goods the first five months of 2013 was ISK 8,800 million or 3.7% lower at current rates of exchange than in the same period the year before, mainly because of decreased imports of ships and aircrafts. Also there was a decrease in the imports of industrial supplies. However, the imports of capital goods increased.
| The value of exports and imports January-May 2013 | |||
| Million ISK at current exchange rate | Change on prev. | ||
| January- | January- | year at current | |
| May | May | exch. rates, % | |
| 2012 | 2013 | Jan.-May | |
| Exports fob, total | 262,015.2 | 251,319.5 | -4.1 |
| Marine products | 111,587.0 | 109,191.2 | -2.1 |
| Agricultural products | 4,986.1 | 4,940.5 | -0.9 |
| Manufacturing products | 138,811.5 | 132,310.9 | -4.7 |
| Other products | 6,630.7 | 4,876.8 | -26.5 |
| Imports fob, total | 236,235.6 | 227,476.0 | -3.7 |
| Food and beverages | 20,666.8 | 21,357.4 | 3.3 |
| Industrial supplies n.e.s. | 72,355.6 | 69,799.4 | -3.5 |
| Fuels and lubricants | 32,434.9 | 32,468.3 | 0.1 |
| Capital goods (except for transport) | 47,768.8 | 54,194.8 | 13.5 |
| Transport equipment | 34,607.5 | 19,992.5 | -42.2 |
| Consumer goods n.e.s. | 28,107.7 | 29,050.0 | 3.4 |
| Goods n.e.s. | 294.4 | 613.7 | . |
| Balance of trade | 25,779.6 | 23,843.4 | . |
¹ Statistics Iceland does no longer publish trade in goods at constant exchange rates. On Statistics Iceland website is available table of the breakdown of trade in goods by currencies.
Monthly figures of external trade for current year are revised together with the release of figures for new months. Annual figures are published in the first half of the year after the end of the reference year. The figures are considered as final at that point
Statistics